The Head Start program promotes school readiness for children from birth to age 5 in low-income families through services that support early learning and development, health, and family well-being. Head Start staff actively engage parents, recognizing family participation throughout the program as key to strong child outcomes. Since its inception in 1965, the Head Start program has served more than 40 million children and their families. In fiscal year (FY) 2023, the Head Start program was funded to serve 778,420 children, pregnant women, and pregnant people in centers, family homes, and family child care homes. The program is rooted in urban, suburban, and rural communities throughout the nation.
For term definitions and fact sheets from other years, see Head Start Program Annual Fact Sheets.
Download the PDF version.
Administration and Federal Budget
The Head Start program is administered by the federal Office of Head Start (OHS), within the Administration for Children and Families (ACF), U.S. Department of Health and Human Services (HHS).
The U.S. Congress authorizes the amount of federal spending for the Head Start program each year. OHS awards nearly all funds directly to public agencies, private nonprofit and for-profit organizations, tribal governments, and school systems for operating Head Start programs in local communities.
| Activity | Amount |
|---|---|
| Head Start Program, Including Early Head Start-Child Care Partnership | $11,589,715,163 |
| Training and Technical Assistance (TTA) | $250,694,126 |
| Research, Demonstration, and Evaluation | $20,430,389 |
| Monitoring Support | $42,000,000 |
| Program Support | $68,176,092 |
| Designation Renewal System (DRS) Transitions Support | $25,000,000 |
| Total | $11,996,015,770 |
Annual Federal Funding and Funded Enrollment by State
The Head Start program serves children, families, and pregnant women and pregnant people in all 50 states, the District of Columbia, and six territories. It encompasses Head Start preschool programs, which primarily serve 3- and 4-year-old children; Early Head Start (EHS) programs for infants, toddlers, and expectant families; American Indian and Alaska Native (AIAN) Head Start programs operated by tribal governments, tribal colleges, or tribal agencies; and Migrant and Seasonal Head Start (MSHS) programs designed to provide program services to farmworker families.
The tables in this section present the total annual federal funding and funded enrollment of Head Start programs in each state and territory, listed by program type. Federal funding amounts include neither TTA funding awarded directly to grant recipients nor state or other funding sources provided to local Head Start programs. Funded enrollment refers to the capacity or number of children and pregnant women and pregnant people supported by federal Head Start funds. It includes slots funded by state or other funds when used by grant recipients as required nonfederal match.
Federal Funded Enrollment and Amounts by State, Excluding AIAN and MSHS Programs
| State | Head Start Preschool Funded Enrollment | EHS Funded Enrollment | Head Start Preschool Annual Operations Funded Amount | EHS Annual Operations Funded Amount |
|---|---|---|---|---|
| Alabama | 9,197 | 3,243 | $111,391,105 | $62,634,542 |
| Alaska | 961 | 336 | $16,538,443 | $6,169,453 |
| Arizona | 9,109 | 3,098 | $131,652,067 | $60,473,542 |
| Arkansas | 5,465 | 3,513 | $54,709,528 | $63,784,919 |
| California | 50,574 | 24,884 | $916,864,291 | $541,092,149 |
| Colorado | 6,583 | 2,198 | $84,786,951 | $40,341,169 |
| Connecticut | 4,381 | 1,585 | $59,028,143 | $35,172,203 |
| Delaware | 1,245 | 471 | $15,830,013 | $8,083,074 |
| District of Columbia | 448 | 1,822 | $6,502,403 | $32,878,764 |
| Florida | 28,546 | 9,698 | $307,870,115 | $184,932,152 |
| Georgia | 17,255 | 4,838 | $195,222,403 | $94,281,695 |
| Hawaii | 2,181 | 721 | $24,500,949 | $11,154,870 |
| Idaho | 1,982 | 645 | $31,115,249 | $12,403,012 |
| Illinois | 17,736 | 11,043 | $248,022,840 | $207,071,808 |
| Indiana | 9,931 | 2,442 | $130,090,516 | $43,177,626 |
| Iowa | 5,157 | 1,770 | $59,823,657 | $29,945,134 |
| Kansas | 4,606 | 1,831 | $64,571,560 | $22,507,185 |
| Kentucky | 10,849 | 3,184 | $137,849,281 | $63,000,122 |
| Louisiana | 15,144 | 3,754 | $163,172,343 | $70,777,315 |
| Maine | 2,080 | 797 | $31,692,779 | $16,363,415 |
| Maryland | 6,738 | 2,254 | $86,567,495 | $49,009,268 |
| Massachusetts | 8,522 | 2,346 | $132,007,052 | $47,344,982 |
| Michigan | 20,739 | 6,853 | $277,972,254 | $129,499,746 |
| Minnesota | 7,357 | 2,138 | $101,149,937 | $38,477,180 |
| Mississippi | 16,169 | 3,770 | $181,453,404 | $69,773,816 |
| Missouri | 9,632 | 3,966 | $138,458,969 | $70,071,562 |
| Montana | 2,286 | 601 | $29,007,155 | $12,363,251 |
| Nebraska | 3,019 | 1,731 | $37,428,495 | $31,064,638 |
| Nevada | 585 | 912 | $9,075,095 | $19,573,614 |
| New Hampshire | 1,135 | 363 | $17,268,434 | $6,009,732 |
| New Jersey | 9,032 | 3,716 | $122,601,805 | $67,723,141 |
| New Mexico | 4,439 | 2,004 | $49,965,629 | $36,683,252 |
| New York | 38,360 | 12,504 | $552,210,035 | $224,602,165 |
| North Carolina | 13,757 | 4,920 | $161,785,836 | $104,758,014 |
| North Dakota | 1,381 | 356 | $19,620,418 | $8,090,422 |
| Ohio | 25,931 | 6,373 | $316,685,692 | $109,670,206 |
| Oklahoma | 9,088 | 3,507 | $85,992,296 | $67,543,261 |
| Oregon | 3,785 | 1,828 | $79,358,682 | $38,308,595 |
| Pennsylvania | 20,729 | 6,765 | $278,574,522 | $107,685,977 |
| Rhode Island | 1,610 | 675 | $26,722,734 | $11,258,089 |
| South Carolina | 8,916 | 2,466 | $101,494,324 | $46,114,555 |
| South Dakota | 1,937 | 529 | $22,846,675 | $8,962,494 |
| Tennessee | 12,858 | 2,159 | $152,638,575 | $43,634,815 |
| Texas | 51,195 | 14,189 | $538,423,499 | $262,691,687 |
| Utah | 3,853 | 1,357 | $65,523,542 | $26,114,236 |
| Vermont | 845 | 538 | $15,277,941 | $11,612,246 |
| Virginia | 10,712 | 3,002 | $119,480,010 | $54,443,923 |
| Washington | 6,960 | 3,310 | $118,236,904 | $71,133,277 |
| West Virginia | 6,642 | 1,082 | $66,755,014 | $17,262,429 |
| Wisconsin | 9,164 | 2,804 | $119,509,965 | $48,674,056 |
| Wyoming | 956 | 352 | $16,467,116 | $6,964,577 |
| American Samoa | 1,332 | 0 | $5,250,063 | $7,615 |
| Federated States of Micronesia | 0 | 0 | $0 | $0 |
| Guam | 534 | 0 | $4,215,811 | $6,115 |
| Republic of the Marshall Islands | 0 | 0 | $0 | $0 |
| Northern Mariana Islands | 396 | 64 | $2,903,746 | $1,178,136 |
| Palau | 350 | 0 | $2,183,899 | $3,168 |
| Puerto Rico | 19,381 | 5,158 | $220,910,561 | $99,424,548 |
| Virgin Islands | 794 | 120 | $10,053,224 | $2,134,946 |
| Subtotal | 544,549 | 186,585 | $7,077,311,444 | $3,556,117,883 |
AIAN funding is awarded to AIAN tribal governments. AIAN programs operate in 26 states, and in some cases, their services cross state lines.
AIAN Federal Funded Enrollment and Amounts by State
| State | Head Start Preschool Funded Enrollment | EHS Funded Enrollment | Head Start Preschool Annual Operations Funded Amount | EHS Annual Operations Funded Amount |
|---|---|---|---|---|
| Alaska | 1,479 | 429 | $29,300,948 | $10,029,246 |
| Arizona | 2,865 | 301 | $41,823,455 | $6,962,406 |
| California | 597 | 196 | $10,497,304 | $4,597,024 |
| Colorado | 56 | 0 | $854,802 | $0 |
| Idaho | 204 | 115 | $3,235,512 | $2,117,309 |
| Kansas | 62 | 47 | $1,277,955 | $1,091,082 |
| Maine | 60 | 0 | $1,136,730 | $0 |
| Michigan | 330 | 232 | $5,027,913 | $3,908,088 |
| Minnesota | 855 | 492 | $12,309,603 | $10,403,829 |
| Mississippi | 192 | 76 | $1,947,883 | $808,355 |
| Montana | 918 | 251 | $10,711,802 | $3,916,956 |
| Nebraska | 219 | 130 | $3,086,611 | $3,234,907 |
| Nevada | 362 | 0 | $4,955,380 | $0 |
| New Mexico | 1,180 | 252 | $15,360,876 | $4,083,690 |
| New York | 143 | 0 | $1,745,494 | $0 |
| North Carolina | 144 | 86 | $1,803,397 | $1,560,581 |
| North Dakota | 743 | 153 | $9,404,475 | $3,070,567 |
| Oklahoma | 2,131 | 390 | $23,331,928 | $7,930,473 |
| Oregon | 318 | 66 | $3,895,253 | $1,391,272 |
| South Carolina | 80 | 32 | $1,171,757 | $855,594 |
| South Dakota | 1,577 | 229 | $21,650,372 | $4,797,625 |
| Texas | 134 | 0 | $1,495,063 | $0 |
| Utah | 215 | 0 | $2,294,357 | $0 |
| Washington | 1,062 | 504 | $16,432,343 | $12,131,886 |
| Wisconsin | 694 | 368 | $8,577,501 | $7,032,591 |
| Wyoming | 165 | 96 | $1,901,331 | $1,537,898 |
| Subtotal | 16,785 | 4,445 | $235,230,045 | $91,461,379 |
MSHS funding and funded enrollment are shown as one total in the table below, as this program supports children and families who receive services in various states during the year. Thus, federal funding and funded enrollment for these services cannot be attributed to individual states. The totals do not include expansion funding opportunities that were posted but not awarded before end of FY 2023 for the listed program types.
| Program Type | Annual Funded Enrollment | Annual Federal Operations Funding |
|---|---|---|
| Head Start Programs, Excluding AIAN and MSHS Programs | 731,134 | $10,633,429,327 |
| AIAN Head Start Programs | 21,230 | $326,691,424 |
| MSHS Programs | 26,056 | $507,016,585 |
| Total | 778,420 | $11,467,137,336 |
Program Year Statistics
Each year, Head Start programs are required to submit Program Information Reports (PIR) on the services they have provided to children and families throughout the program year, including child, family, and staff demographics and program characteristics.
For a copy of the PIR form, detailed reports, data sets for the 2023 PIR and prior years, and further information, please visit the Program Information Report (PIR) page.
Program Characteristics
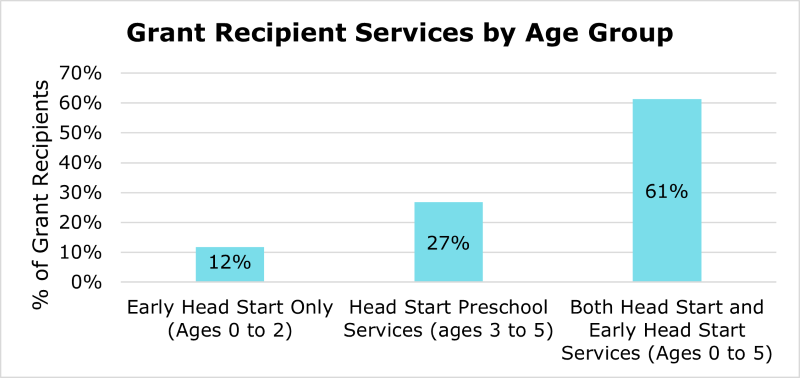
Most grant recipients provided both Head Start and Early Head Start services during the 2022–2023 program year.
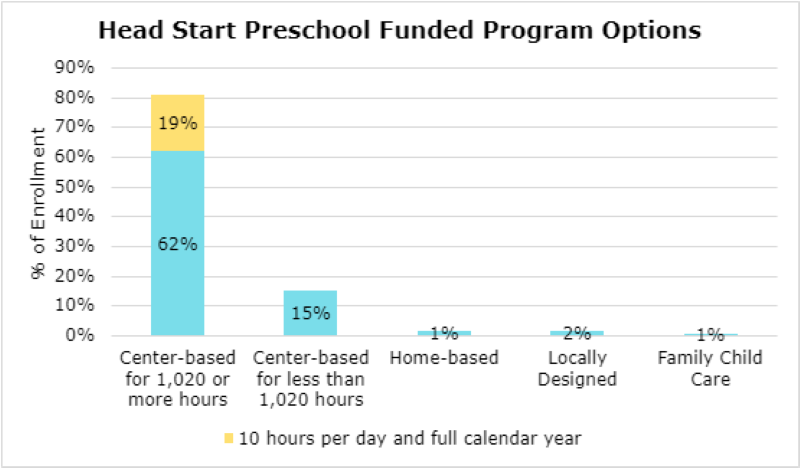
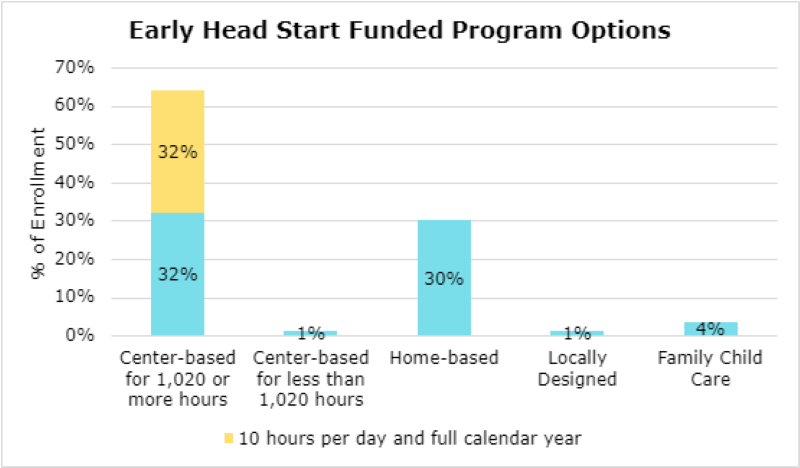
About 97% of funded Head Start preschool services were in center-based settings, and the majority were funded for 1,020 or more hours, including 20% to operate in center-based settings for 10 hours per day for the full calendar year. About 65% of funded EHS services were in center-based settings, including about 49% to operate in center-based settings for 10 hours per day for the full calendar year. Additionally, about 30% of funded EHS services were in home-based settings.
Child and Family Demographics
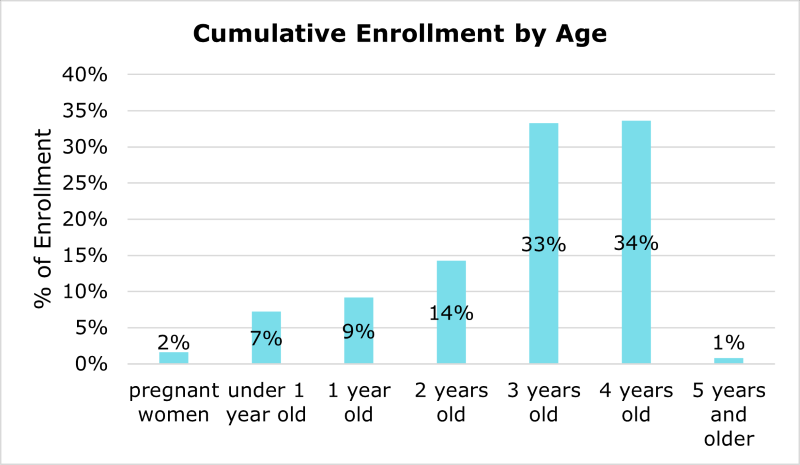
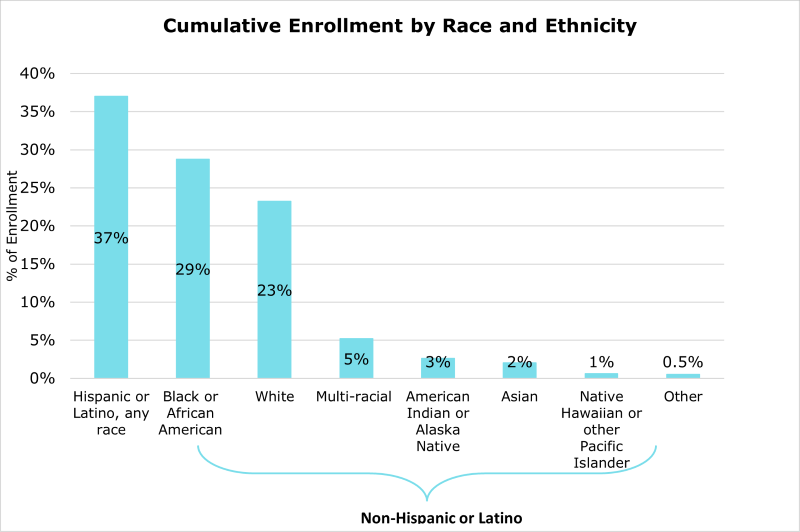
During the 2022–2023 program year, programs experienced significant challenges in meeting full enrollment during which were primarily workforce related and largely due to staff shortages. Head Start programs cumulatively served 799,901 children ages birth to 5 and pregnant women and pregnant people throughout the 2022–2023 program year.
Note that cumulative enrollment refers to the actual number of children, pregnant women, and pregnant people that Head Start programs served throughout the entire program year, inclusive of enrollees who left during the program year and the enrollees who filled those vacancies. Due to turnover, more children and expectant families may receive Head Start services cumulatively throughout the program year, all of whom are reported in the PIR, than indicated by the funded enrollment.
The Head Start program served a diverse group of children, families, and pregnant women and pregnant people. Thirty-seven percent identified themselves as Hispanic or Latino, and 29% were Black or African American, non-Hispanic or -Latino. Additionally, about 34% of children enrolled were dual language learners, of which nearly two-thirds were in families that primarily spoke Spanish at home.
Services to Children and Families
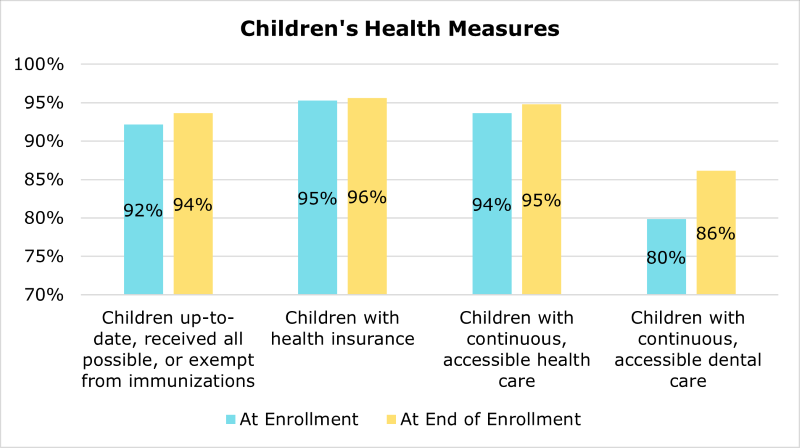
Head Start programs work with families to help ensure children have access to needed services and resources. The number of children who were up to date on immunizations (or had otherwise received all possible immunizations, or were exempt) increased from the beginning of the program year to the end of the program year. Also, more families had continuous, accessible health care and dental care for their children at the end of the 2022–2023 program year than at the beginning.
Head Start programs work with families to ensure they have the means to obtain health insurance, services for children with disabilities, adequate housing, job training, and more.
During the 2022–2023 program year:
- Most children had public health insurance. At the end of the program year, 96% of children had health insurance and were primarily enrolled in Medicaid or the Children's Health Insurance Program (CHIP) program.
- Fourteen percent of Head Start cumulative enrollment was made up of children with disabilities, defined as children having special plans under the Individuals with Disabilities Education Act (IDEA).
- Among pregnant women and pregnant people enrolled in EHS, approximately 86% received prenatal education on fetal development and 25% had medically high-risk pregnancies.
- The Head Start program served about 723,000 families cumulatively throughout the program year. The number of families served is less than the number of participants served, since some families have more than one child enrolled.
- Approximately 48,000 families served during the enrollment year experienced homelessness. Of those families, 23% found housing during the program year. Approximately 51,000 Head Start families received housing assistance, such as subsidies, utilities, and repairs.
- Approximately 80,000 families, or 11%, received services related to job training and adult education, such as general equivalency diploma (GED) programs and college selection.
Program Staff
Head Start programs employed and contracted with 250,000 staff. Parents of current or former Head Start children made up 23% of Head Start staff.
- Approximately 542,000 adults volunteered in their local Head Start program. Of these, 400,000 were parents of Head Start children.
- About 113,000 staff members provided child development services to children, including teachers, assistant teachers, home visitors, and family child care providers.
- Among child development staff, 31% were proficient in a language other than English
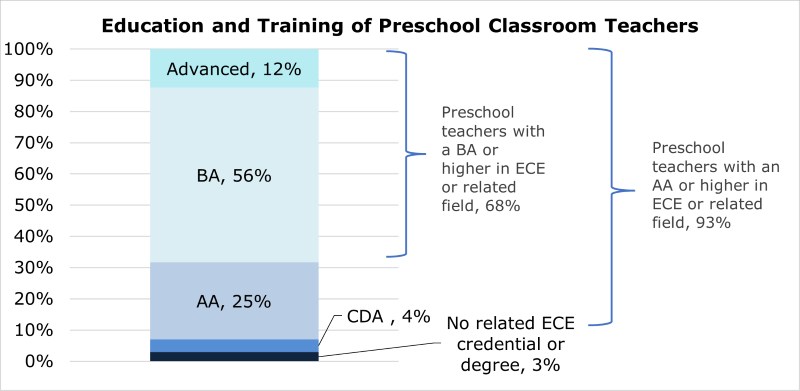
- Of all Head Start center-based preschool teachers, 68% had a baccalaureate degree or higher in early childhood education or a related field with experience. The Head Start Act specifies that 50% of center-based preschool teachers nationwide should have had these credentials by 2013.
« Go to Head Start Program Annual Fact Sheets
Last Updated: August 26, 2024