During the 2019–2020 program year, the Office of Head Start (OHS) used the Classroom Assessment Scoring System (CLASS®) Pre-K Teacher-Child Observation Instrument during its on-site reviews of grantees. CLASS-reliable reviewers visited a random sample of preschool classrooms to obtain grantee-level scores. This document provides descriptive statistics of the 2020 grantee-level CLASS data.
For more information, see: Use of CLASS in Head Start, available on the ECLKC. Individual grantee CLASS reports also are available on the ECLKC in the Grantee Service Profiles.
National Statistics by Dimension
In 2020, 78 Head Start grantees received CLASS reviews. Fewer grantees received CLASS reviews in FY2020 than in previous years due to the impact of coronavirus disease 2019 (COVID-19). The CLASS tool has 10 dimensions of teacher-child interactions rated on a 7-point scale, from low to high. The 10 CLASS dimensions are organized into three domains: Emotional Support, Classroom Organization, and Instructional Support.
- Emotional Support assesses the degree to which teachers establish and promote a positive climate in their classroom through their everyday interactions.
- Classroom Organization assesses classroom routines and procedures related to the organization and management of children's behavior, time, and attention in the classroom.
- Instructional Support assesses the ways in which teachers implement the curriculum to effectively promote cognitive and language development.
| OHS CLASS® Descriptive Statistics, 2020 National Grantee-Level Scores by Dimension |
|||||
|---|---|---|---|---|---|
|
Domain |
Dimension |
Mean |
Standard Deviation |
Minimum |
Maximum |
|
Emotional Support |
Positive Climate |
5.98 |
0.28 |
5.17 |
6.61 |
|
Negative Climate |
1.09 |
0.08 |
1.00 |
1.50 |
|
|
Teacher Sensitivity |
5.88 |
0.30 |
5.06 |
6.63 |
|
|
Regard for Student Perspectives |
5.33 |
0.38 |
4.10 |
6.19 |
|
|
Classroom Organization |
Behavior |
5.96 |
0.33 |
5.29 |
6.75 |
|
Productivity |
6.07 |
0.35 |
5.00 |
6.81 |
|
|
Instructional Learning Formats |
5.32 |
0.37 |
4.43 |
6.14 |
|
|
Instructional Support |
Concept |
2.46 |
0.41 |
1.76 |
3.46 |
|
Quality of Feedback |
2.90 |
0.40 |
2.08 |
3.88 |
|
|
Language |
3.45 |
0.48 |
2.22 |
4.50 |
|
National Statistics by Domain
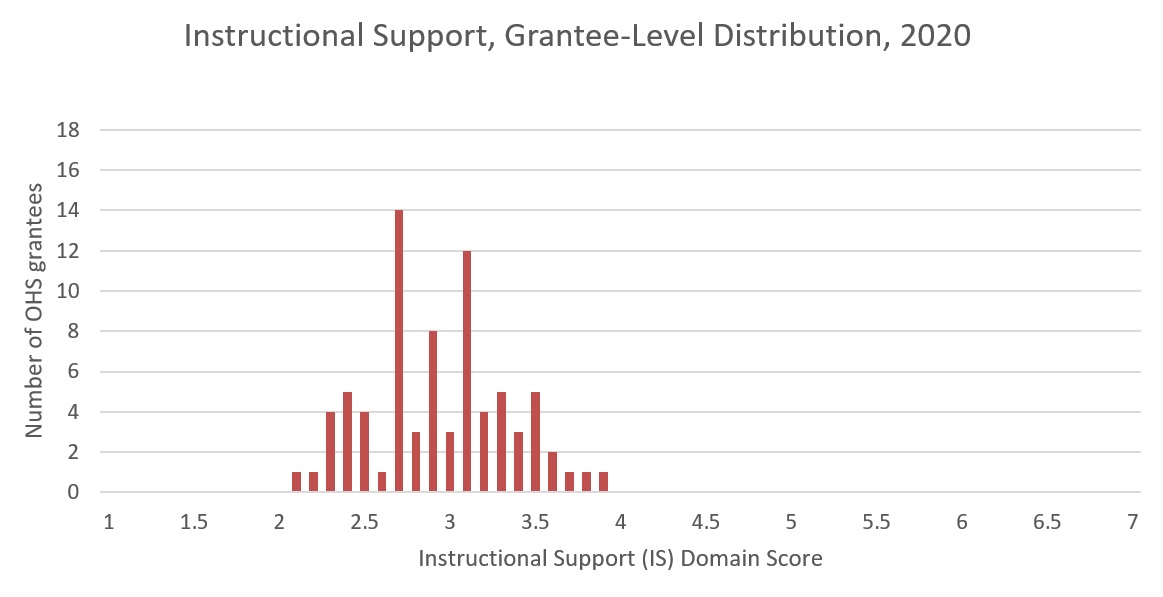
Grantee-level dimension scores are averaged to produce grantee-level domain scores.* Previous large-scale studies of CLASS have shown that the average preschool classroom scores are higher in the domains of Emotional Support and Classroom Organization than in the domain of Instructional Support.
| OHS CLASS® Descriptive Statistics, 2020 National Grantee-Level Scores by Domain |
||||
|---|---|---|---|---|
|
Domain |
Mean |
Standard Deviation |
Minimum |
Maximum |
|
Emotional Support |
6.03 |
0.21 |
5.42 |
6.42 |
|
Classroom Organization |
5.78 |
0.31 |
5.06 |
6.56 |
|
Instructional Support |
2.94 |
0.40 |
2.11 |
3.88 |
*Note: To calculate the Emotional Support domain, subtract the Negative Climate score from 8, add the Positive Climate, Teacher Sensitivity, and Regard for Student Perspective scores, then divide by 4.
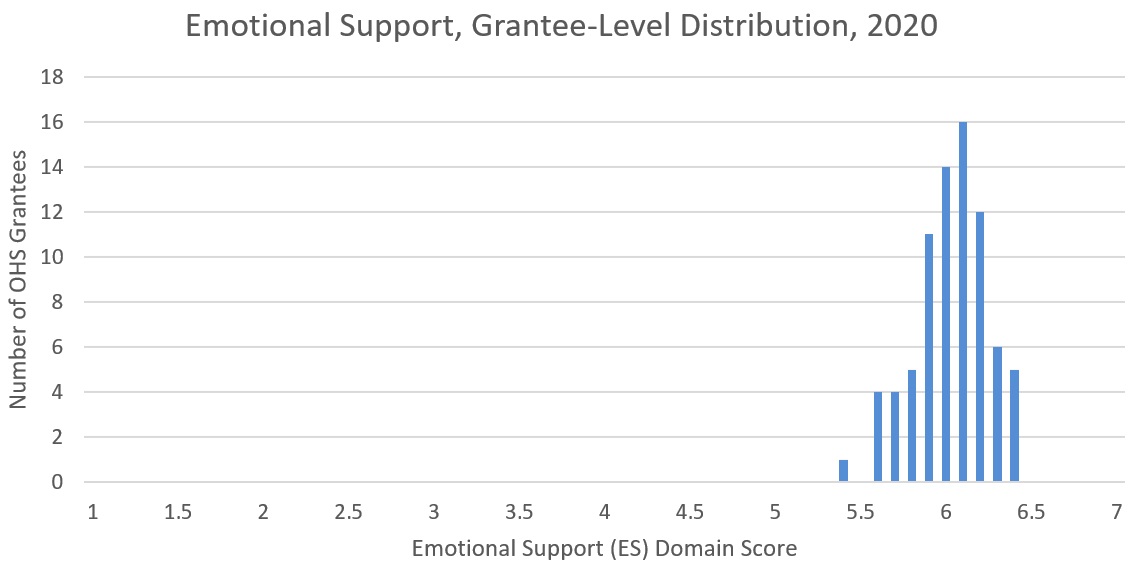
Distribution by Domain
The following table and graphs provide additional information on how grantee-level domain scores are distributed nationally.
| OHS CLASS® Descriptive Statistics, 2020 National Distribution of Grantee-Level Domain Scores |
|||
|---|---|---|---|
|
Domain |
Lowest 10% |
Median (50%) |
Highest 10% |
|
Emotional Support |
5.6750 |
6.05 |
6.32 |
|
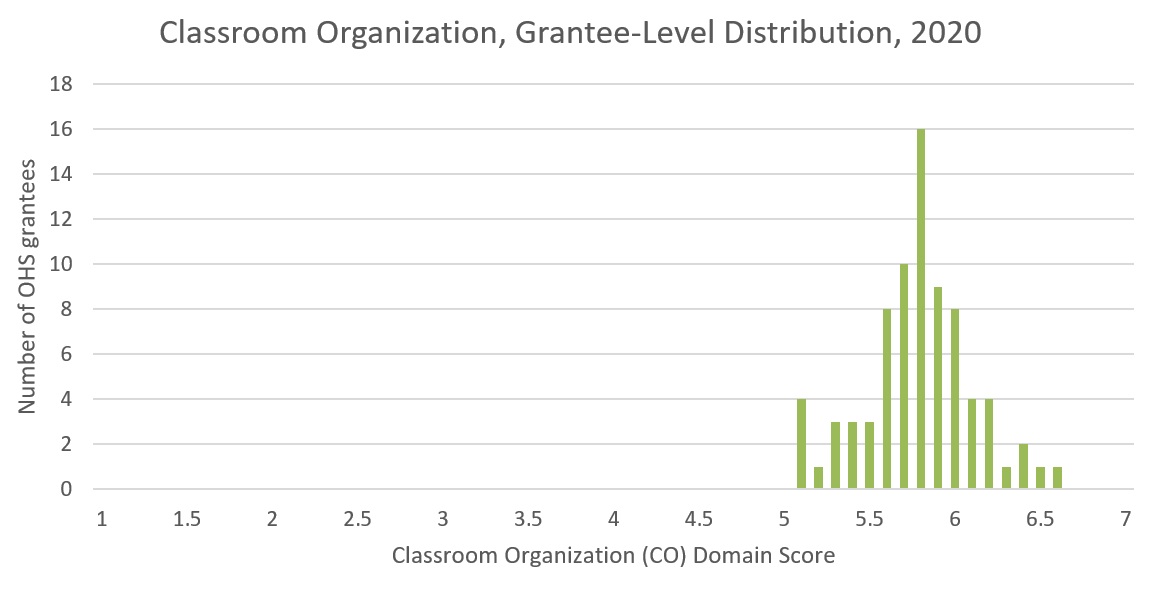
Classroom Organization |
5.3175 |
5.80 |
6.17 |
|
Instructional Support |
2.3889 |
2.94 |
3.52 |
Glossary
Mean: the average value, calculated by summing all scores and dividing by the number of scores
Median: the middle value, where half the scores are below this point and half are above it
N: the total number of values in a set
Standard Deviation: a value that shows how much variation exists in a set of data. There are two types of standard deviation (i.e., sample and population). We use the population standard deviation because this data set includes all 2020 CLASS scores.
« Go to National Overview of Grantee CLASS® Scores by Year
Last Updated: March 7, 2023