Find out how to use the Head Start Dashboard to learn about the traffic on HeadStart.gov and identify trends among its users. There is also a Head Start Mobile Apps Explorer for basic analytics on all Head Start mobile apps.
The National Centers Dashboard allows to users filter the traffic based on the National Center creating or managing its content.
For those interested in comparing and analyzing the top search terms for both internal and external search, please see the Top Search Terms console.
Terms
These definitions reflect common dimensions for analytics captured on the HeadStart.gov:
- Campaign / Campaign ID: The name and ID of a promotion or marketing campaign
- Event name: The name of an event
- Landing page: The page path and query string of the first pageview in a session
- Medium: The method for bringing users to a page or application
- Page path and screen class: The page path from a website URL and screen class from a mobile application
- Page referrer: The referring URL, which is the user's previous URL and can be your website's domain or other domains
- Page title: The page title that you set on your website
- Source: A representation of the publisher or inventory source from which traffic originated (e.g., users who return to your website from Google Search show as "google" in the Session source dimension)
These definitions reflect common metrics associated with analytics captured on the HeadStart.gov:
- Bounce rate: The percentage of sessions that were not engaged sessions
- Engaged sessions: The number of sessions that lasted 10 seconds or longer, has a key event, or has at least two or more page or screen views
- Engagement rate: The percentage of sessions that were engaged sessions
- Entrances: The number of times that the first event recorded for a session occurred on a page or screen
- Exits: The number of times that the last event recorded for a session occurred on a page or screen
- Event count: The number of times users triggered an event
- Views: The number of mobile app screens or web pages your users saw (counts repeated views of a single screen or page)
- Sessions: The number of sessions that began on your website or application. Every session is a group of user interactions with your website or app that take place within a given time frame.
- Users: The number of distinct users who visited your website or application.
Dashboard Page Summaries
The Head Start Dashboard aggregates select web metrics to show activities, patterns, and trends for HeadStart.gov content. Use it to obtain a snapshot of traffic, compare traffic to the previous period, and isolate data for specific pages and events. Please share and bookmark the URL.
The Dashboard provides analytics for all the site's content, with the previous calendar month as the default setting. The site content can be changed with the Date drop-down menu at the top of every page. Once chosen, your date selection will persist across all of the Dashboard's pages until you reset it. Various pages have additional page-specific filters to allow users to explore specific subsets of the website analytics data in more detail.
The sections below describe the different components of the Dashboard by page.
Overview
This page summarizes web traffic for the entire site during the specified period. The data reflects the current health of the site, including total reach and the top entry and exit pages. It also shows which channels are used to enter the site. Organic search typically generates the most traffic to HeadStart.gov, followed by direct search. Top pages and landing pages reflect the most popular content on the site. Landing pages are pages that users view first; they should guide users to other pages on the site.
Topics
This section of the dashboard focuses on the usage of the numerous Topic landing pages found on HeadStart.gov.
Topic Page Usage
View page-based metrics for the Topic landing pages in this section. The metrics at the top show total use during the specified period and the percentage of change compared with the previous period. The Most Popular Topic Areas table displays the number of page views and corresponding metrics, indicating the extent of user engagement.
To use the Topic Page Usage Diagram:
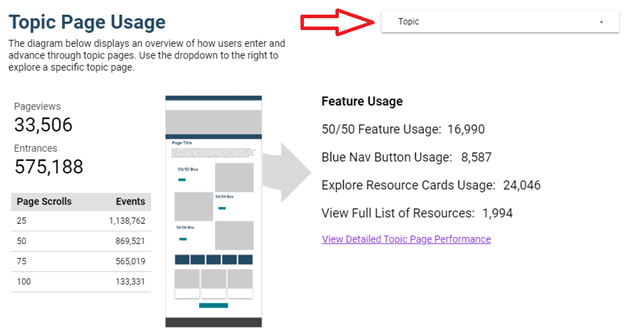 Select specific Topic landing pages from the drop-down menu for the corresponding metrics. Otherwise, the data displayed includes metrics for all the Topic landing pages collectively.
- Page Scroll measures the average depth reached in increments of 25% when moving downward on the specified pages.
- View the Driving Traffic to Topic Pages table to compare direct entry on the Topic landing pages from the separate channels.
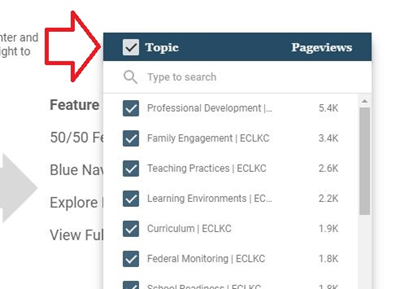
Select the Topic button in the middle of the page to view metrics for specific topics. The default setting includes all Topic landing pages. Use the checkbox next to the Topic landing page column label to toggle between selecting or deselecting these pages. You can also use the checkbox next to each Topic landing page title to select or deselect it. Use the search field beneath the table header to locate a Topic page by name or scroll through the full list. The number that appears in parentheses on the right-hand side of the Topic column label shows the total number of topics to be included among the results. Once done, use the Esc key to display the results of your selection.
Detailed Topic Page Usage
 This detailed breakdown of features shows the performance of specified Topic landing pages. It reflects usage patterns of these features and the extent of user engagement. For example, high click-through rates for specific positions of the 50/50 features and the blue Featured Resource buttons indicate that they attract significant attention. Content curators should place high-priority content in these positions.
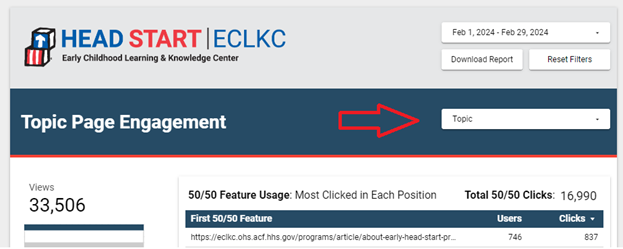
Select the Topic button in the upper right-hand corner to view page engagements of specific Topic landing pages. The default setting includes all these pages. Hover over a specific Topic page title to select or deselect it. You can use the search field beneath the table header to locate a Topic page by name or scroll through the full list. Once done, use the Esc key to display the results of your selection. The number that appears in parentheses on the right-hand side of the Topic landing page title shows the total number of these pages included among the displayed results. The results can show metrics of only one Topic landing page at a time.
Resources
This section focuses on the usage of the resources and the pages that host these throughout HeadStart.gov.
Resource Page Usage
The metrics at the top of this page provide collective data on resource pages. They include the total traffic during the specified period and the percentage of change compared with the previous period. View the number of users for individual resource pages by topic and type in the separate tables. View the Resource Usage table for views, sessions, and related metrics of the individual resource pages.
Select one of the following buttons across the top of this page to filter the results: Date Created, National Center, Resource Type, or Topic. For each, the default settings include all items in the respective dataset. Use the checkbox next to the first (left) column label to toggle between selecting or deselecting specific items. You can use the search field beneath the table header to locate an item by name or scroll through the full list. Use the checkbox next to each title to select or deselect it. Once done, use the Esc key to display the results of your selection.
Resources Videos
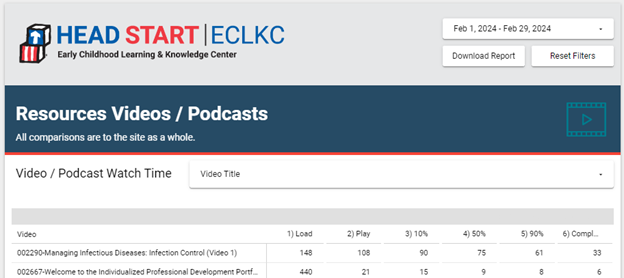 Data presented on this page shows traffic for videos and podcasts consumed. Select the Video Title button at the top of the page to filter the results. For each, the default settings include all items in the respective dataset. Use the checkbox next to the column label to toggle between selecting or deselecting all items. You can use the search field beneath the table header to locate an entry by name or scroll through the full list. Then use the checkbox next to each title to select or deselect it. Once done, use the Esc key to display the results of your selection.
Traffic
This section focuses on external traffic to the website from various channels promoting content on HeadStart.gov.
Email Traffic
The summary metrics across the top of this page show overall web traffic from emails. The table below the aggregate totals show the results of individual e-blasts. The line chart on this page shows email traffic by date. The separate table at the bottom highlights the top landing pages and related metrics for email campaigns.
To view email performance by campaign, adjust the data displayed on the line chart. Select the Campaign drop-down at the middle-right side of the page. Each entry displays the number of corresponding sessions. The default setting includes all campaigns.
Select the checkbox next to the Campaign column label to toggle between selecting or deselecting all campaigns. Then use the checkbox next to each campaign to select or deselect it. The number that appears in parentheses on the right-hand side of the Campaign column label shows the total campaigns to be included among the results. Once done, use the Esc key to display the results of your selection.
Social Traffic
View traffic from Office of Head Start (OHS) social media networks on this page. The metrics across the top reflects aggregate totals. The data includes the number of sessions from the separate social networks (Facebook, Instagram, LinkedIn, Instagram, YouTube, and X/Twitter) and the corresponding metrics. The pie chart displays the portion of this traffic from each network.
For social media traffic by date, examine the line chart. Select a specific social network in the Social Network Trends section to view the corresponding landing pages and metrics. Otherwise, this data reflects the traffic from all social networks together. Examine the number of entrances on the landing pages and the number of pages per session to evaluate the impact of social network traffic on the site.
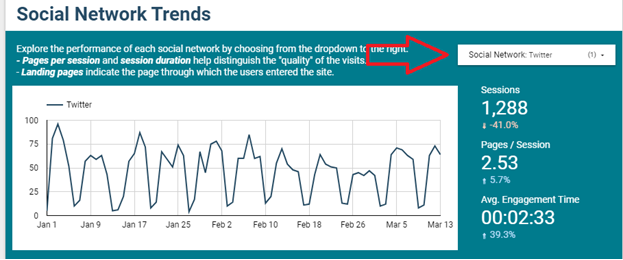
Select the Social Network button to filter the results. Use the checkbox next to the Social Network column label to toggle between selecting or deselecting all OHS social networks. You can use the search field beneath the table header to locate a network by name. Then use the checkbox next to each network title to select or deselect it. Once done, use the Esc key to display the results of your selection. The number that appears in parentheses on the right-hand side of the Social Network column label shows the total number of networks included in the displayed results.
Insights
This section focus efforts to better understand specific demographics using HeadStart.gov and/or pages of interest throughout the website.
Page Insights
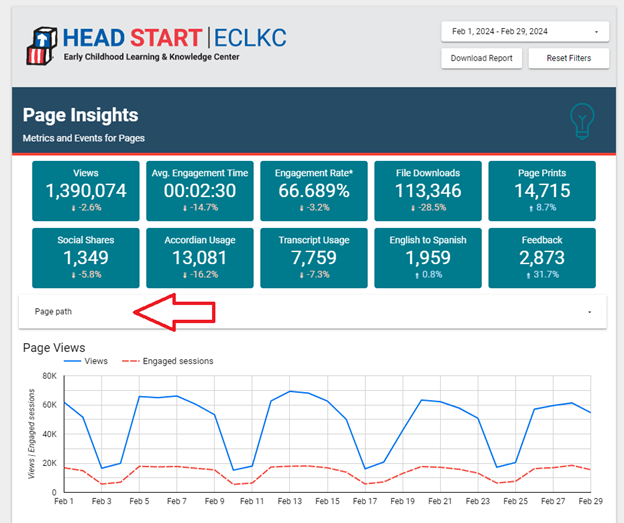 View the top metrics and events from individual HeadStart.gov pages. The cards across the top reflect high-level aggregate totals of various important metrics generally found on a page. The data below includes a graph for daily views and engaged sessions, a table for page metrics, and numerous custom implemented events that occur throughout the site: file downloads, clicks, menu clicks, interactions, header/footer clicks, and page scrolls.
Select the Page path button to filter the results. Use the checkbox next to the Page path column label to toggle between selecting or deselecting a single or multiple HeadStart.gov pages. You can use the search field beneath the table header to locate a page by path. Then use the checkbox next to each page to select or deselect it. Once done, use the Esc key to display the results of your selection. The number that appears in parentheses on the right-hand side of the Page path column label shows the total number of pages included in the results.
Language Insights
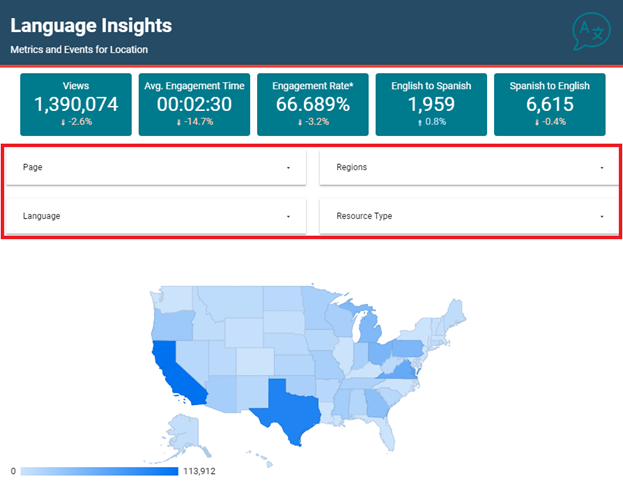 View the top metrics and resource downloads by language and location. The cards across the top reflect high-level aggregate totals of various important metrics. The data below includes a map of views, a graph for daily views and engaged sessions, a table for page metrics, and a table for resource downloads.
Select the Language, Page, Region, or Resource Type buttons across the top of this page to filter the results. For each, the default settings include all items in the respective dataset. Use the checkbox next to the first (left) column label to toggle between selecting or deselecting specific items. You can use the search field beneath the table header to locate an item by name or scroll through the full list. Use the checkbox next to each title to select or deselect it. Once done, use the Esc key to display the results of your selection.
Dashboard Settings and Features
Follow the instructions below to adjust the data displayed on the Dashboard.
Date Range
Select the date range button at the top of each page to change the period of the data shown. The latest 30-day period is the default setting. To change this period, select new start and end dates from the pop-up window. Alternatively, select one of the preset periods such as "This Month," "Last Month," etc., from the drop-down menu. Access this menu by selecting the upside-down triangle adjacent to the option displayed (e.g., Fixed). Some options provide a checkbox to include the current date. Select the "Apply" button to submit the new period.
Export Data
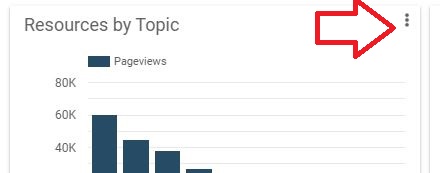 Select the button of three vertical dots to export the data in tables or charts (Figure 1). To display this button, place your mouse over the specific table or chart. It will appear on the right-hand side of the header line. Individual metrics that reflect aggregate totals cannot be exported, although the export button will appear next to them.
Sort Data
Select the column label in tables to sort the corresponding data in either descending or ascending order (Figure 2). As the default, the dashboard sorts data in descending order. The upside-down triangle next to the column label identifies the default dimension.
View More Data
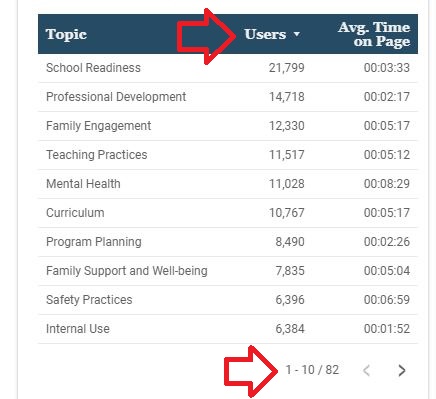 Select the "greater than" (>) or "less than" (<) symbols at the bottom of tables to view the next or previous group of entries (Figure 3). The status field adjacent to these symbols shows the current group of entries displayed and the total number of entries (e.g., 1 – 10 / 32).
Last Updated: March 31, 2025